DAG showcase
The repo’s examples/dag-showcase/ is a compact multi-branch project. It exercises file sources, SQL nodes, derive/filter/aggregate chains, terminal stat nodes, report metadata, and cache behavior.
What’s inside
Section titled “What’s inside”- Sources:
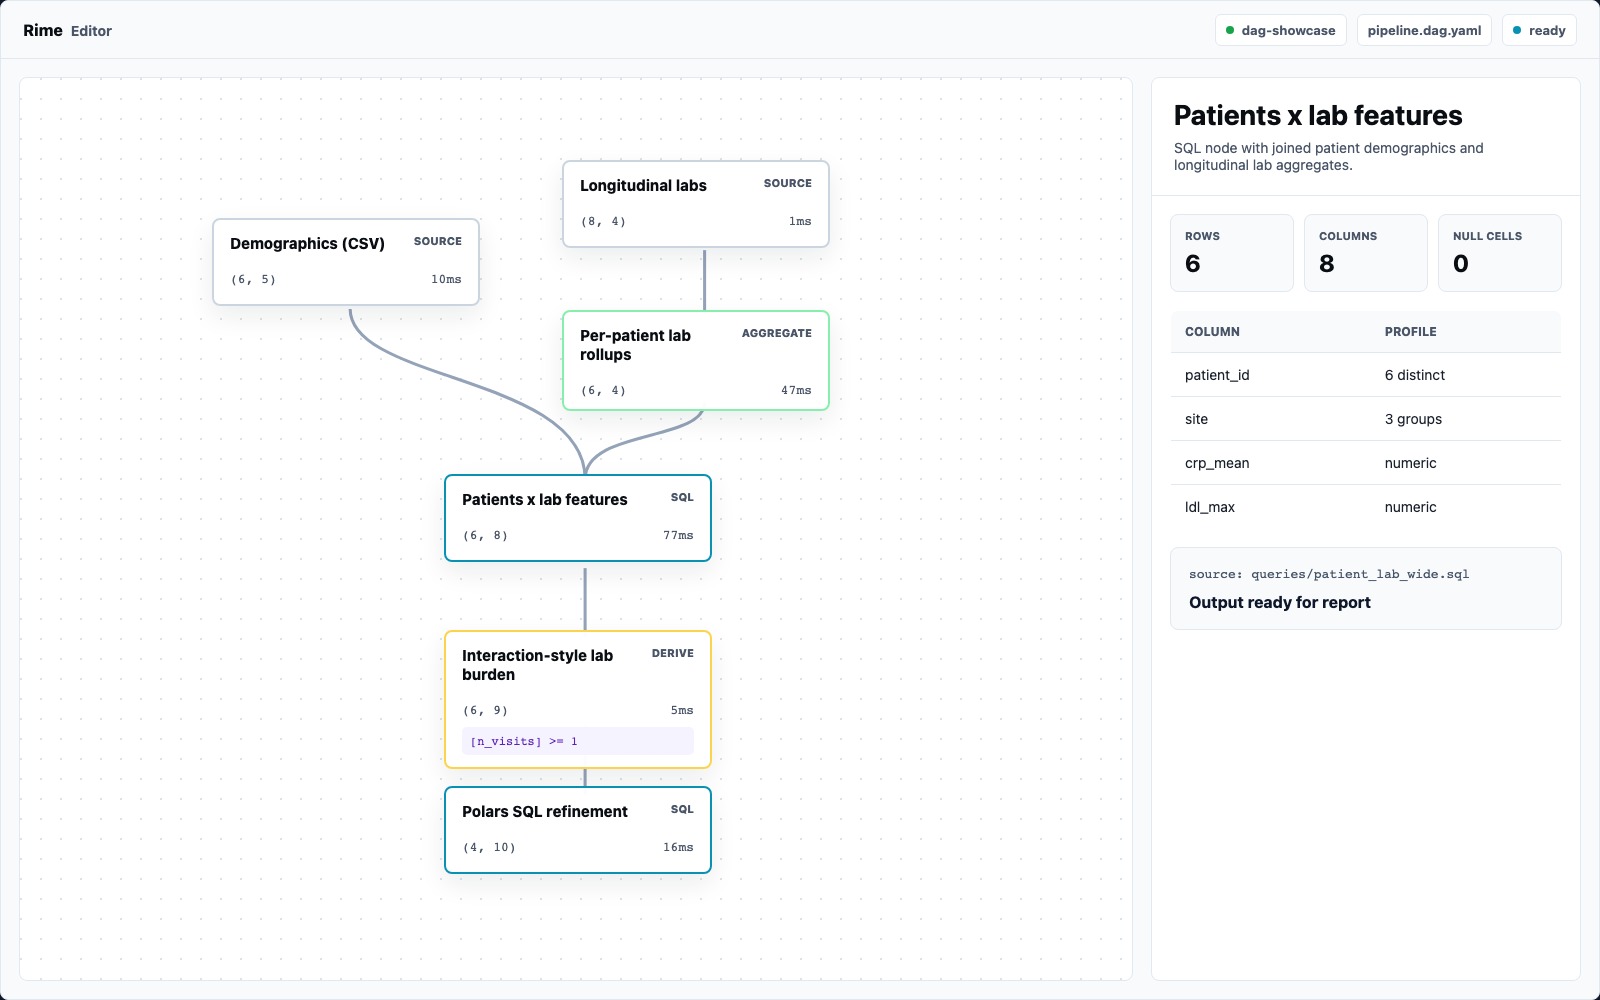
data/patients.csv(demographics) anddata/lab_visits.parquet(longitudinal labs), wired inline on each source node viapath:inpipeline.dag.yaml - DAG: multi-branch pipeline - aggregate labs per patient, join to patients in SQL, derive lab/risk features, refine the cohort, roll up by site, and finish with correlation and chi-square statistics
- Linked scripts (human-edited reference):
scripts/python_biomarker_features.py—n_visits ** 1.2featurescripts/risk_adjust.R— baseline z-score + flagqueries/patient_lab_wide.sqlandqueries/sql_cohort_refine.sql— SQL source files used by the runnable DAG
patients_source ─┐ ├─► patient_lab_wide ─► lab_load ─► risk_indexlabs_source ─► lab_agg ┘ │ ▼repeat_visitors ─► sql_cohort_refine ─► py_biomarker_features │ ▼ r_risk_adjust ─► r_risk_flag │ ┌──────────────────────────┼────────────────────┐ ▼ ▼ ▼ site_outcomes crp_vs_baseline site_age_chisqThe py_biomarker_features and r_risk_adjust nodes are implemented as
core derive nodes in this example so it can run without Python/R sidecars.
The adjacent scripts show the equivalent language-node logic.
Running it
Section titled “Running it”From the repo root:
# Validaterime validate examples/dag-showcase/pipeline.dag.yaml
# Run (data outputs only)rime run examples/dag-showcase/pipeline.dag.yaml
# Build (run + render the generated HTML report)rime build examples/dag-showcase/pipeline.dag.yaml
The report is written to examples/dag-showcase/outputs/run_report.html.
Why this example matters
Section titled “Why this example matters”It is the smallest checked-in pipeline that touches several Rime surfaces at once:
| Feature | Demonstrated by |
|---|---|
| Multiple source kinds | patients (CSV) + lab_visits (Parquet) |
| Built-in transforms | filter / derive / aggregate chains |
| SQL nodes (with inputs) | sql_patient_lab joining cohort + labs |
| SQL nodes (ingress-only) | sql_cohort_refine reading from parquet directly |
| Language-node migration pattern | derive nodes mirror the checked-in Python/R scripts |
| Stat nodes | correlation + chi_square over the rolled-up site outcomes |
| Multi-branch graph | independent feature + risk branches that converge at the site rollup |
| Report rendering | Generated report includes DAG nodes unless metadata.report: false |
What To Inspect
Section titled “What To Inspect”pipeline.canvas.jsonto see the saved editor layout for this project.queries/patient_lab_wide.sqlto see SQL named slots in action.outputs/site_outcomes/default.parquetfor the final reporting rollup.outputs/crp_vs_baseline/default.jsonandoutputs/site_age_chisq/default.jsonfor terminal stat-node objects.outputs/run_report.htmlfor output sizes, warnings, and table previews.
If you want a smaller starting point, see examples/single-file/.