Dataset scanning in Rime Editor
Dataset scanning is the editor workflow that makes Rime feel different from editing YAML alone. Every table-producing node can be inspected as a concrete dataset: shape, columns, samples, profiles, and the script or expression that produced it.
What The Preview Shows
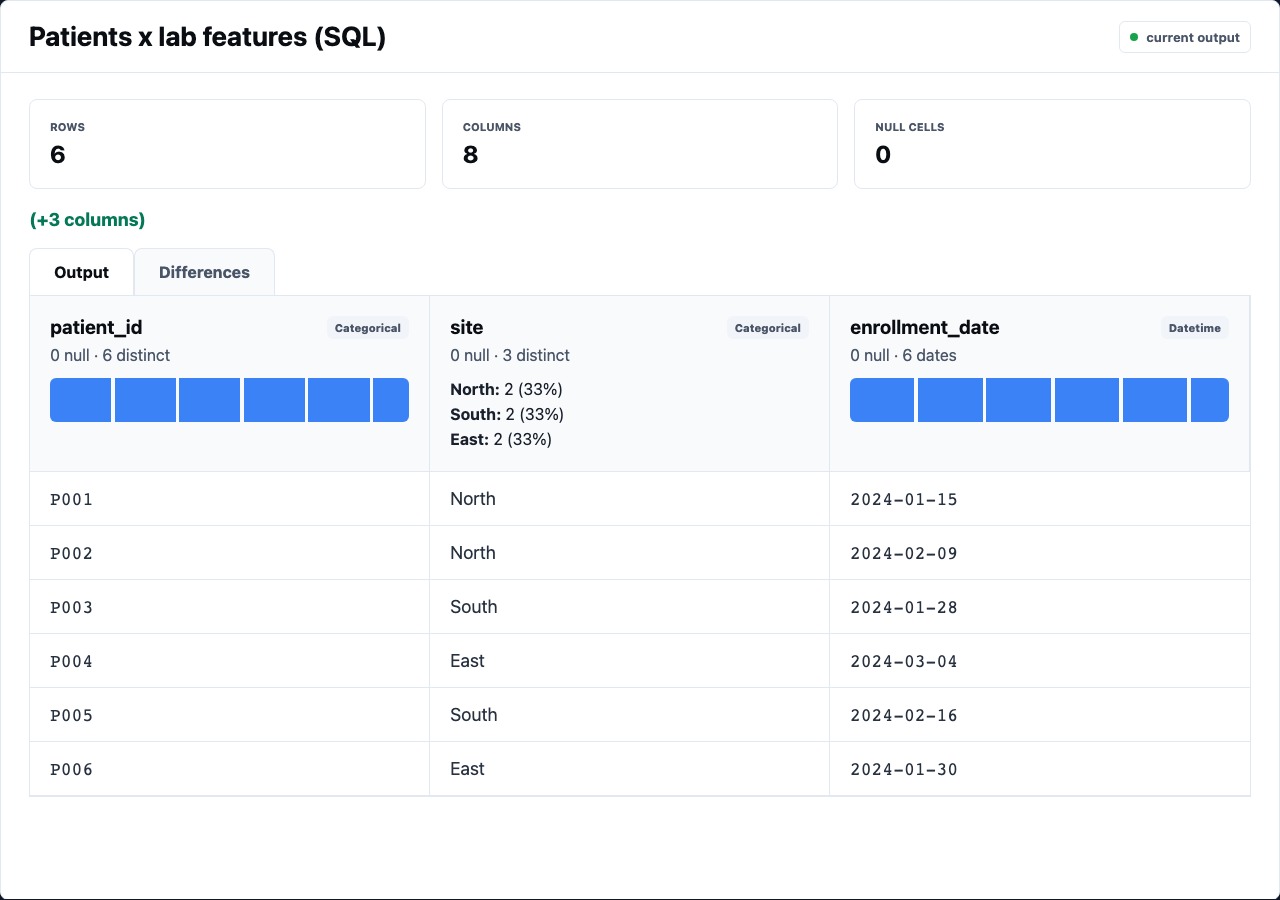
Section titled “What The Preview Shows”The selected node panel should make the output legible before you read any code:
| Surface | Why it matters |
|---|---|
| Shape tuple | The fastest signal that a node changed row or column count |
| Cache/run state | Explains whether you are seeing fresh output or a cached artifact |
| Column profiles | Shows type, nulls, cardinality, and distribution hints |
| Row sample | Lets you inspect real values without opening a notebook |
| Source/config | Keeps the SQL, script, expression, or YAML beside the data it produced |
The point is not to replace analysis. The point is to make obvious pipeline mistakes visible immediately: empty cohorts, exploded joins, unexpected nulls, accidental wide pivots, or feature columns with nonsense ranges.
What To Check By Node Type
Section titled “What To Check By Node Type”Sources
Section titled “Sources”Source nodes should show file path, inferred shape, sampled rows, and column profiles. For CSVs, check whether numeric-looking columns inferred correctly and whether empty strings became null.
Filters
Section titled “Filters”Filters should make row-count loss obvious. A filter that keeps zero rows may be logically valid, but it usually deserves a second look before downstream stats run.
- id: repeat_visitors kind: filter inputs: [risk_index] expr: "[n_visits] >= 1"Derives
Section titled “Derives”Derived columns should be easy to find in the preview. Inspect the new column’s profile before trusting downstream results.
- id: lab_load kind: derive inputs: [patient_lab_wide] as: lab_load expr: "[crp_mean] * [ldl_max] / 1000.0"Joins deserve row-count attention. If an inner join unexpectedly shrinks the table, inspect key coverage. If a left join expands rows, check for many-to-many matches.
Aggregates And Pivots
Section titled “Aggregates And Pivots”Aggregate and pivot nodes usually change shape dramatically. The output column names are part of the review: aliases like [mean_risk_index] should read like report-ready metrics.
Column Profiles Are Review Aids
Section titled “Column Profiles Are Review Aids”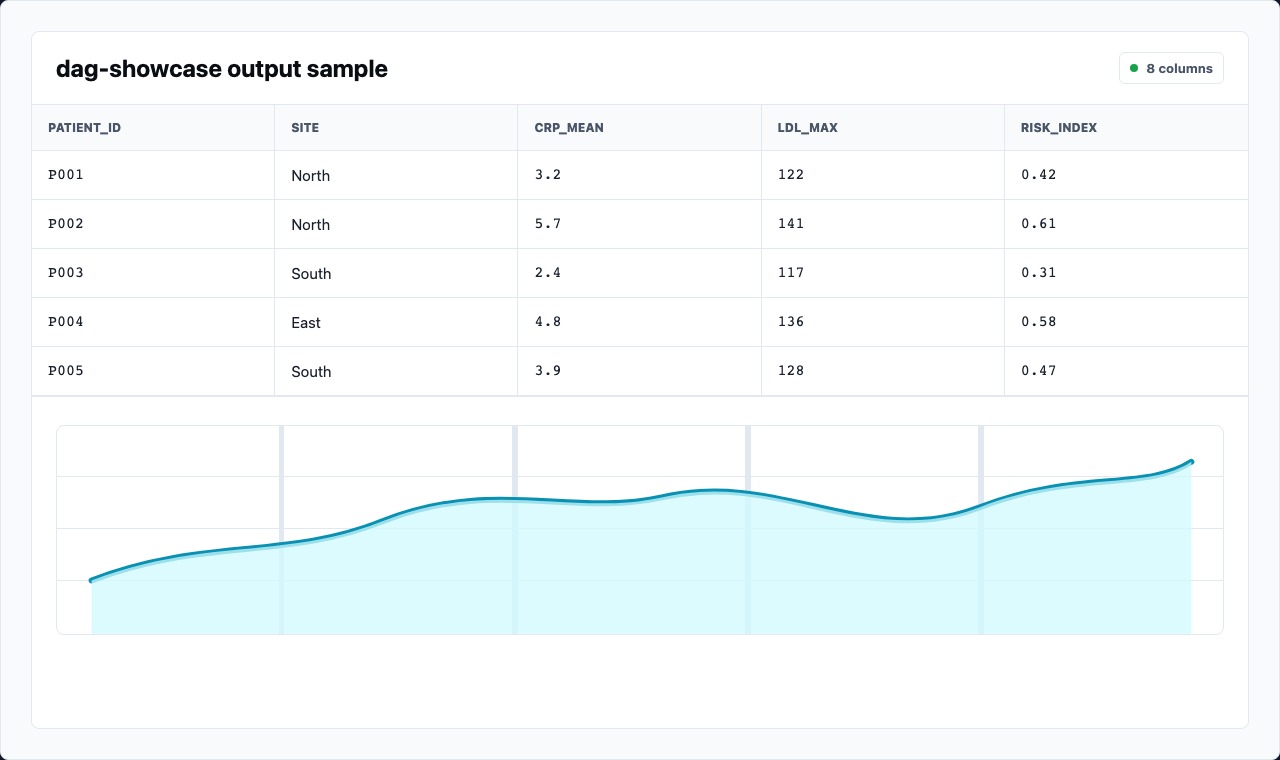
Column profiles are useful because they compress a lot of context:
- null count can reveal failed joins or missing source values
- cardinality distinguishes IDs from low-cardinality groups
- numeric distributions make outliers and impossible values visible
- type hints show whether a field is usable in expression nodes and statistical nodes
When a node uses the expression language, profiles are often the quickest way to decide whether the formula made sense.
Scan Before You Script
Section titled “Scan Before You Script”A good Rime workflow is:
- Use core nodes for visible transformations.
- Scan each output as it changes.
- Drop to SQL/Python/R/JavaScript only when the core-node expression would be harder to review than code.
- Return to the scan surface after the script node runs.
The editor is not trying to hide code. It is trying to keep code and data side by side.