Author the DAG without losing the YAML.
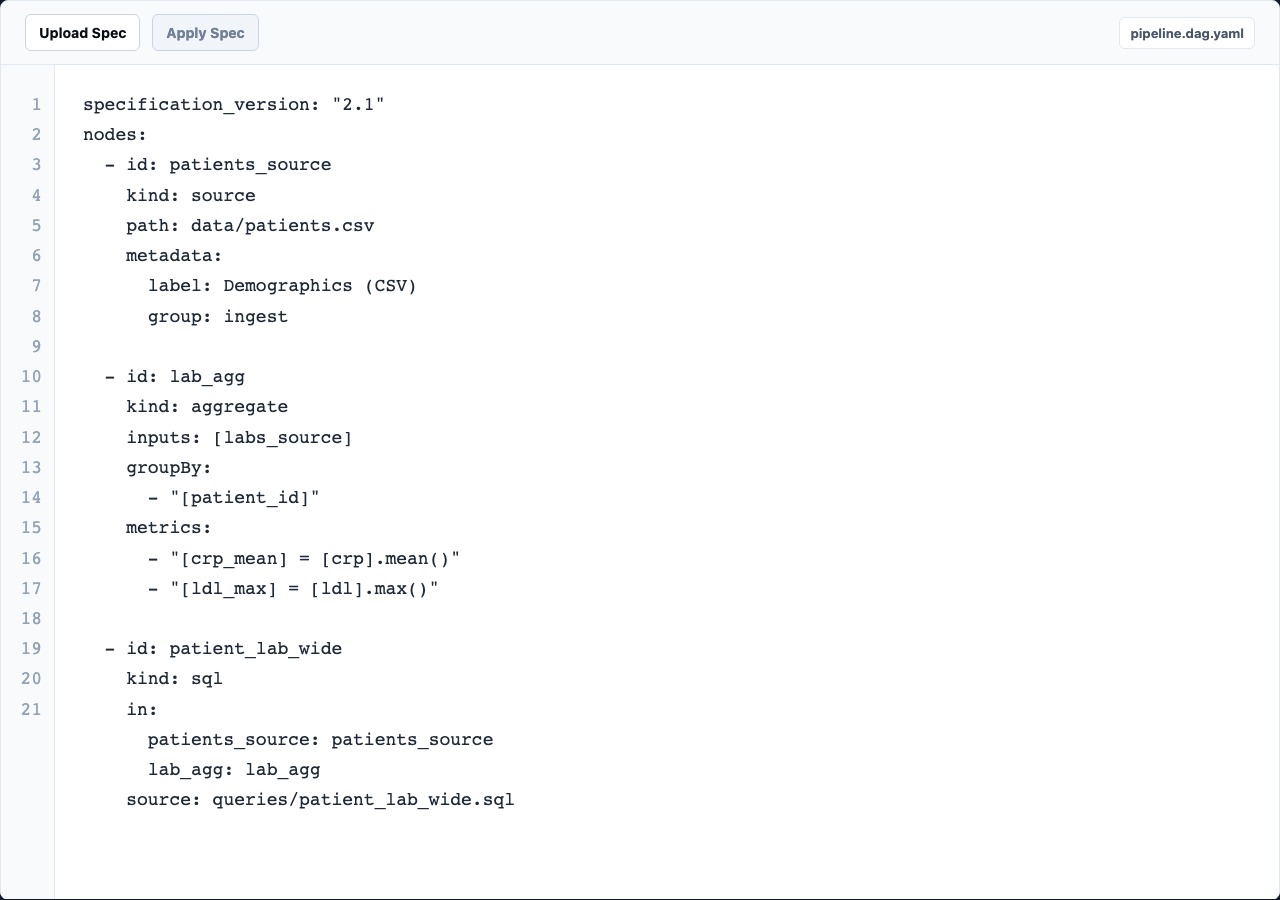
Drag through the pipeline, select nodes, and keep the current spec visible when you want the raw model.
The visual desktop workbench for Rime pipelines is not publicly available yet. It is planned as the place to shape DAGs, inspect tables, edit scripts, and review reports without leaving the project.
Public downloads are not available yet. The CLI is the supported way to run Rime today; this page previews the intended desktop workflow and keeps the Editor guides in one place while the product is being prepared.
Not available for download yet
Drag through the pipeline, select nodes, and keep the current spec visible when you want the raw model.
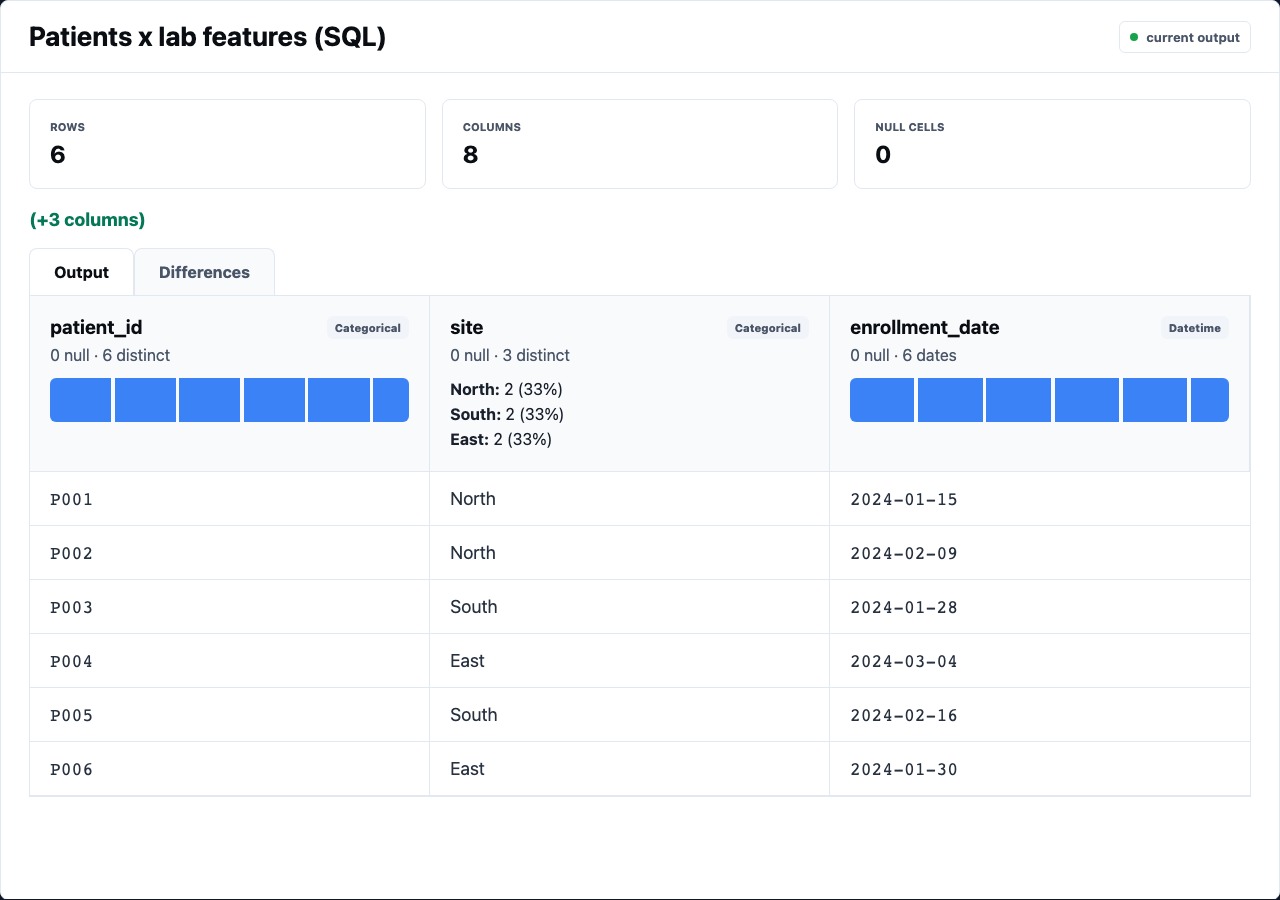
Table previews lead with shape, null count, cardinality, column profiles, and sampled rows before code.
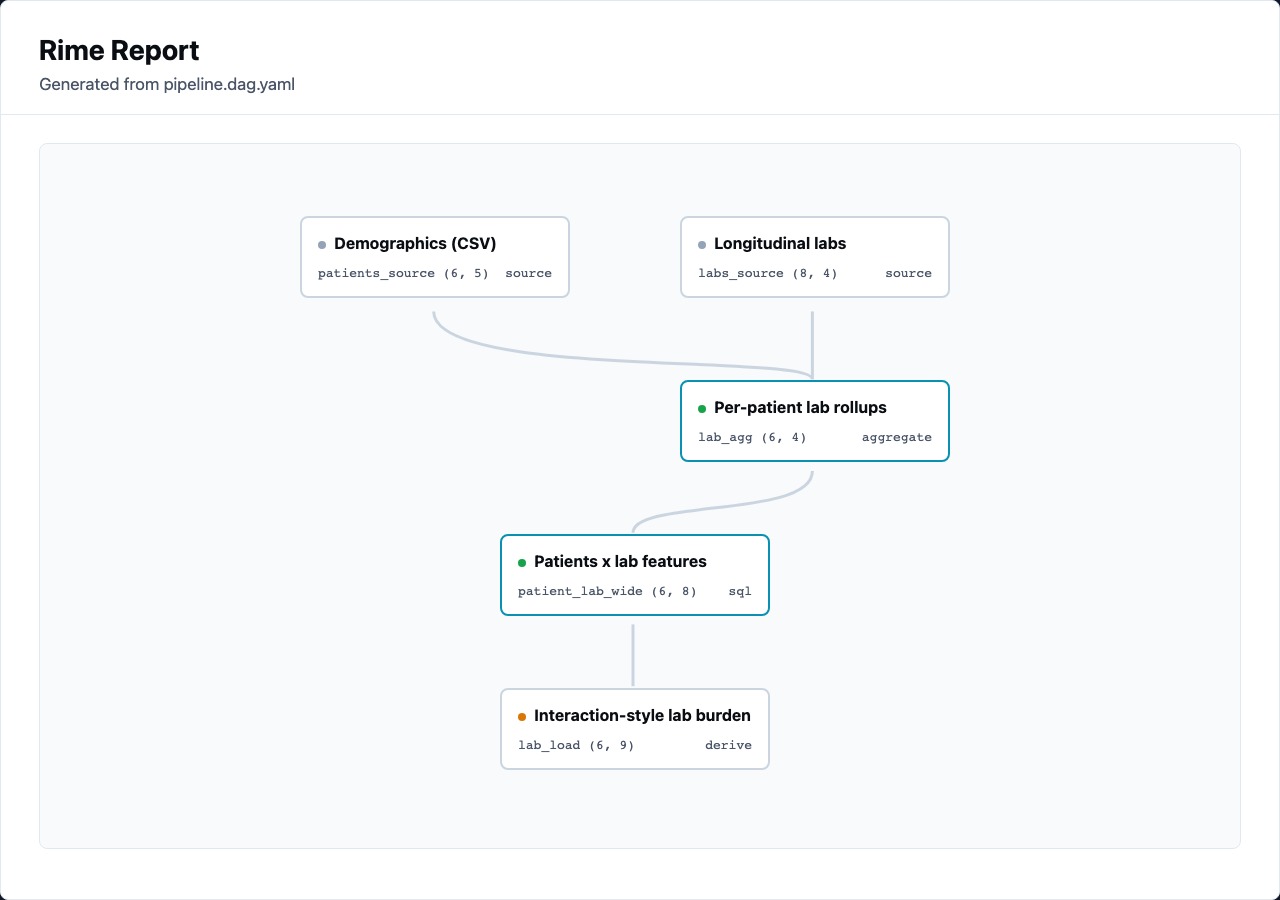
The report view renders the current pipeline with graph structure, table shapes, warnings, and outputs.
Visual graph, right-side inspector, data grid, script source, and report preview sit in one desktop workflow.
The editor is intentionally narrower than general docs. It explains the desktop workflow: open a project, inspect data, adjust nodes, and review output.
Load the pipeline, see cached nodes, and orient around the canvas.
Use the node panel to inspect table shape, columns, diffs, warnings, and source.
Move between visual controls, YAML, and script source without leaving the run context.
Preview the current report in-app or open the generated file in a browser.
Rime Editor keeps the pipeline concrete: graph structure, YAML, table previews, SQL, and reports all point back to the same node ids.
nodes:
  - id: patient_lab_wide
    kind: sql
    in:
      patients_source: patients_source
      lab_agg: lab_agg
    source: queries/patient_lab_wide.sql

  - id: sql_cohort_refine
    kind: sql
    in:
      repeat_visitors: repeat_visitors
    source: queries/sql_cohort_refine.sql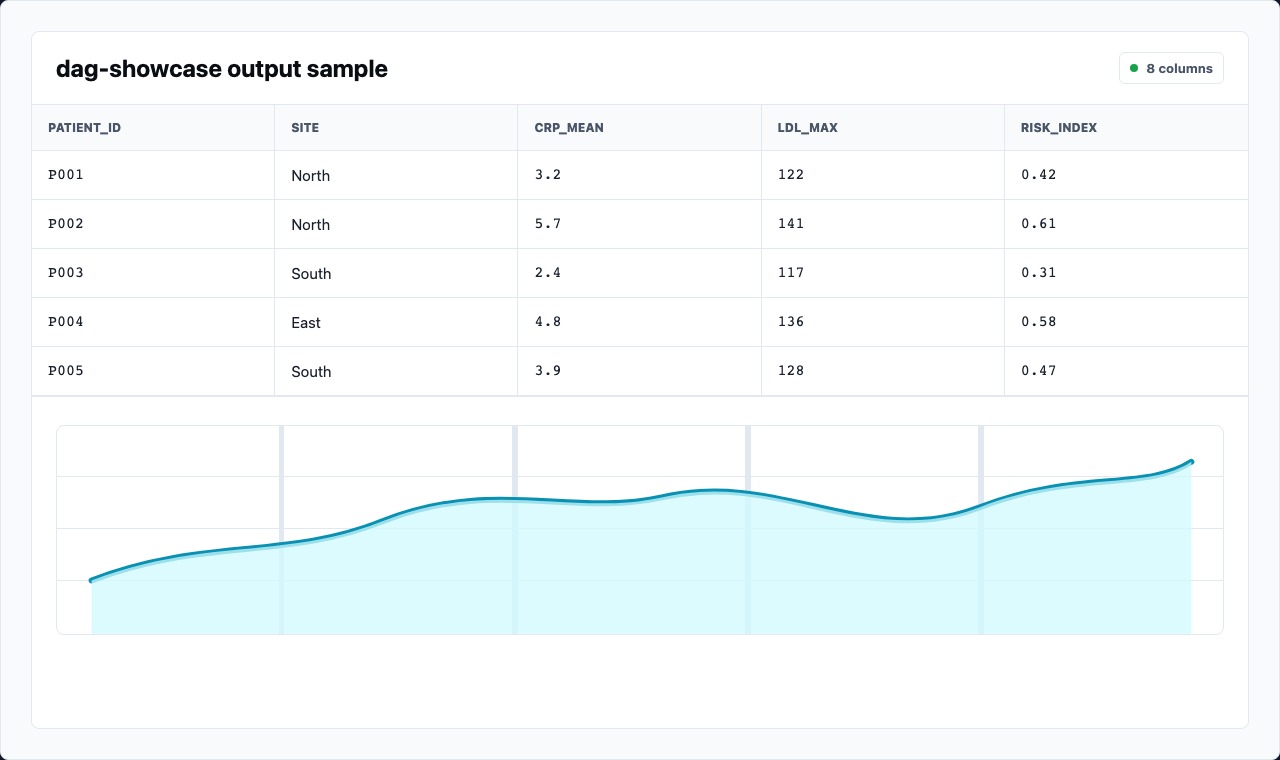
A compact project that walks through CSV and Parquet sources, SQL nodes, derived metrics, statistics, and report output.
Open exampleThese pages stay focused on the desktop product experience. Runtime concepts can stay in the Rime CLI documentation.
Preview the planned project workflow and main editor surfaces.
Read guideUse table metrics, column profiles, row samples, and diffs while selecting nodes.
Read guidePreview the current report, inspect output sizes, and open the artifact in a browser.
Read guide